

Notes from the desk of the editor are offered in the interests of personal posterity and transparency for writers and other potential editors who wish to learn from my experience.
the editor
Let’s preface this post with a note that I’m not a marketing expert. I’m not even a marketing student. I’m a marketing novice. I’ve been throwing things at the wall and seeing what sticks.
The goals for marketing our brand and our books (two interdependent elements of this machine) is to find readers for the books and to find readers and financial backers for brand products. I believe we have an excellent product (our stories, our writing-related content, and services rendered to authors), and finding the people who want that product (and it is specific to the niches in which we’re operating) is the overall goal.
How might we measure the degree to which we are or are not successful?
“Book sales” might be one answer, but the trouble is that even in the shortest-term window of consideration possible, we’re still 10 months away from the beginnings of an answer to that question—and realistically we won’t have an answer until we begin publishing individual authors (or have out several anthologies). That means I have to find other ways of measuring impact.
“Site Traffic” is a possible stand-in for brand success, but it’s not a 1:1 correlate for “find readers for our books and find readers and financial backers for brand products”.
It’s risky, I think, to get too caught up in site data—the goal isn’t to generate maximum traffic, of course, but to generate useful traffic. And I can’t measure utility directly without having a measure, again, for book sales (not expecting big sales from anthologies no matter what, so individual author publishing, which is a few years away, will be our most direct measure of success) and author-services (videos, publishing of short stories, editing service, etc.) engagement.
So I can’t directly measure anything I’d call “overall success” for Whisper House Press. Absent that data, I can look at how things are trending on the site, on my socials, etc. (In my last post, I mentioned “building the machine,” and this stuff all contributes to that machine.)
Let’s look at data since site creation way back in 2012. That’ll give us a fair baseline against which to measure site growth.
This first screenshot is from wordpress’s “annual insights” page and measures things like total words posted, words per post, comments on posts altogether and on average, and total posts. This data is interesting for reasons other than book sales. You can see that the year I became engaged and got married (2018) and bought a home, renovated that home, etc. etc. etc. was a two-post year for me. And the year prior, when I was dating long distance but spent six+ weeks in Europe (and wanted to share about it), I wrote and posted a lot.
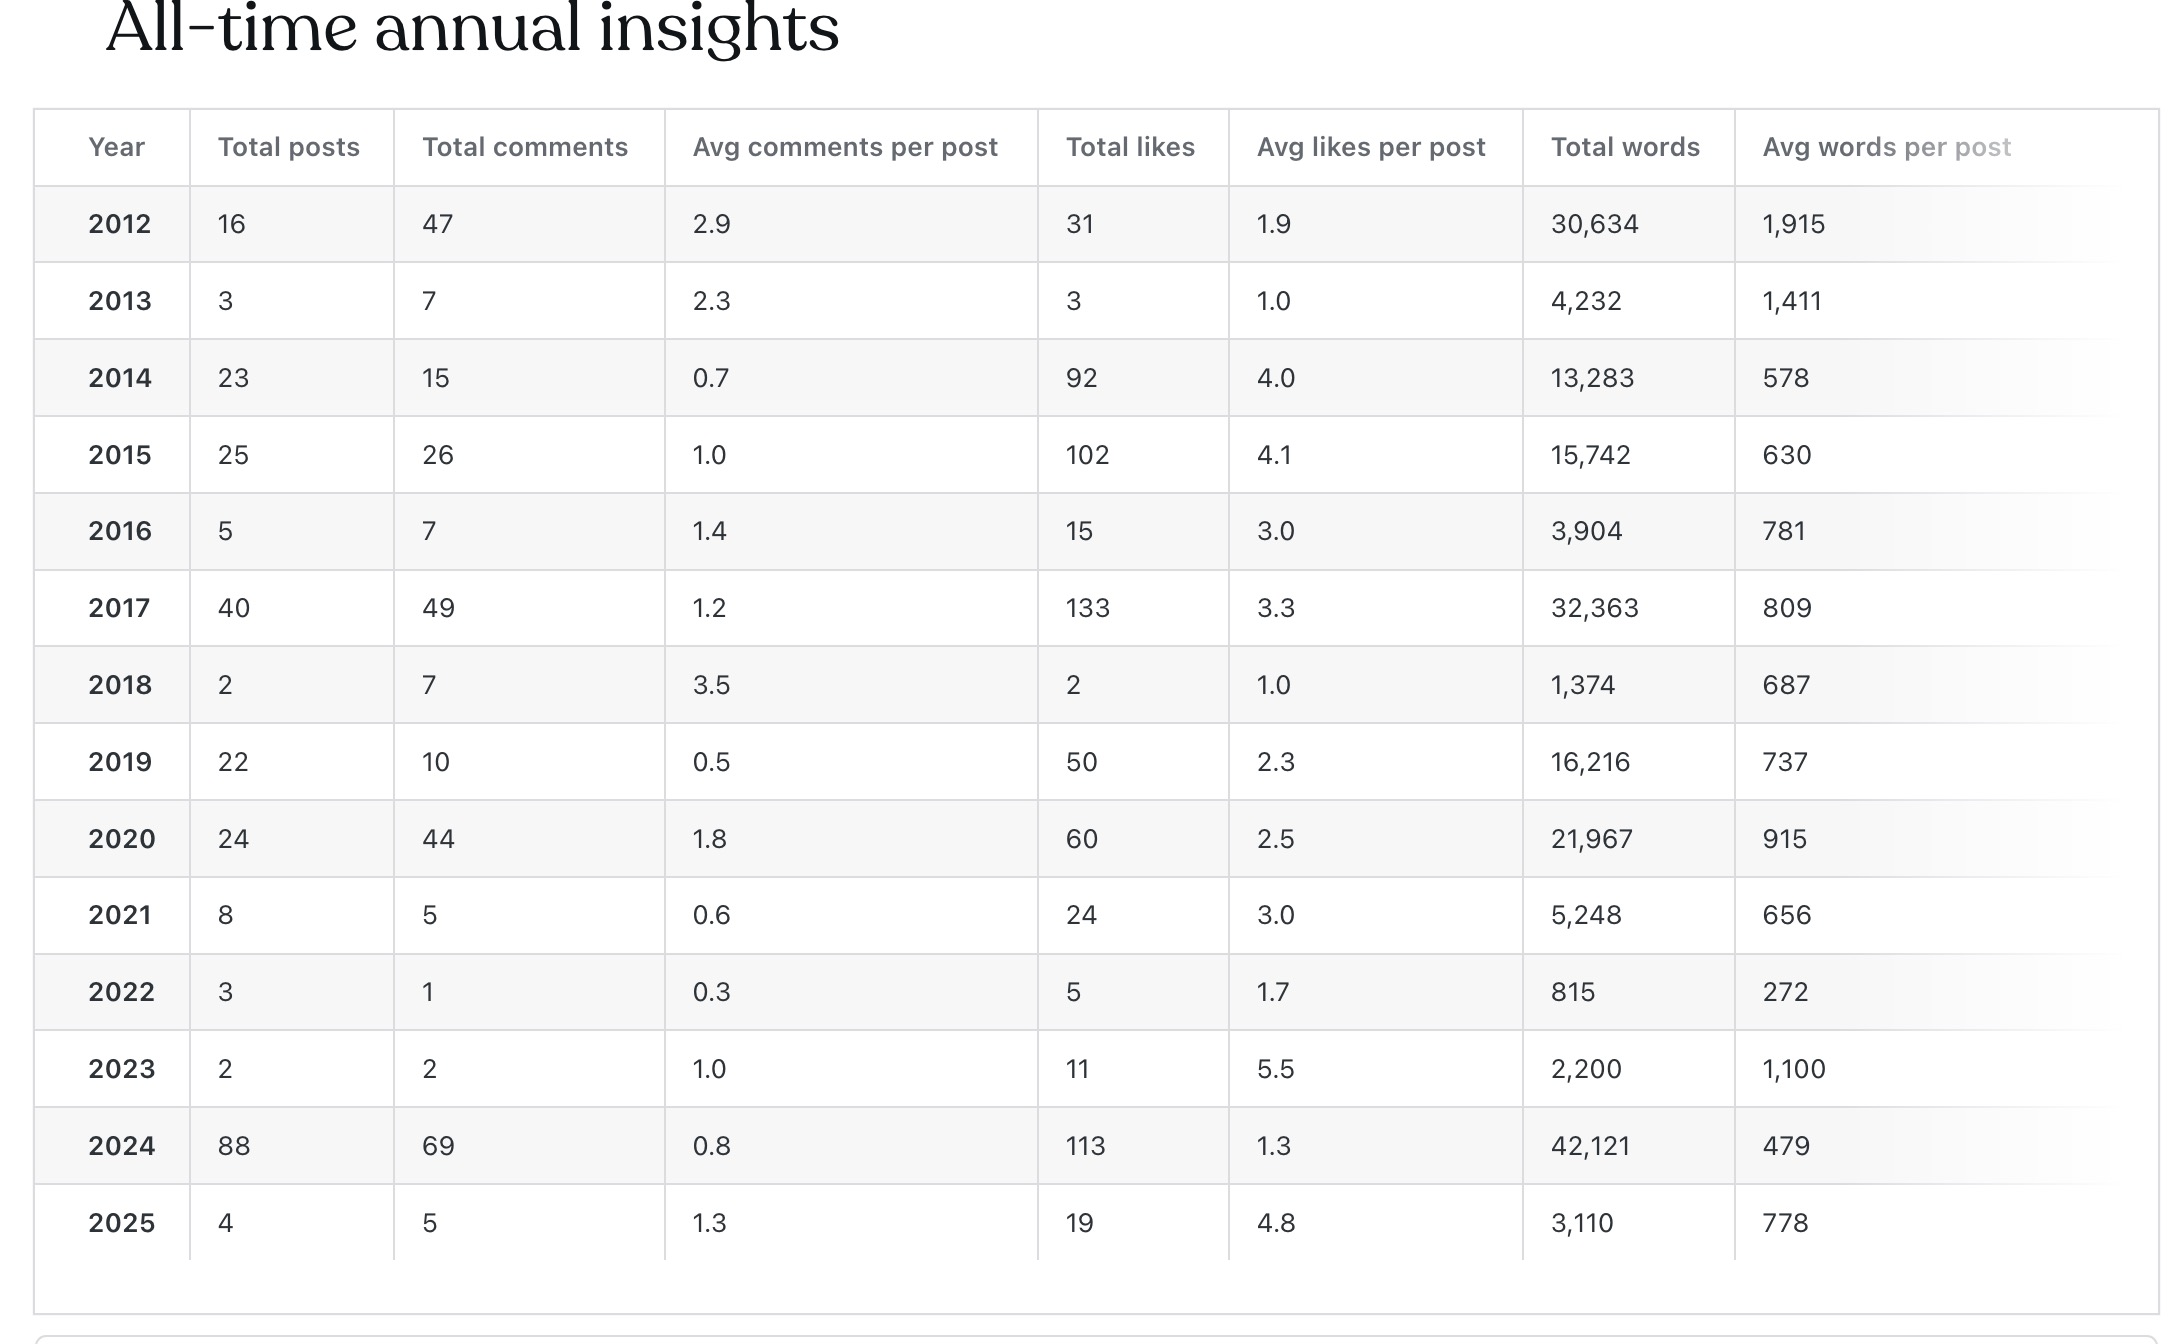
Compare that “biggest year before Whisper House Press” to this first year of Whisper House Press (not even a full year, since we began operations in April 2024) and you’ll find a 33ish percent increase in word output and a doubling of total posts. Interesting, but ascribing meaning is tricky: 2024 featured the shortest average word count, near lowest average likes per post, near lowest average comments per post… and that makes me wonder: is my goal increased likes and comments? Probably not. But it’s interesting to me, anyhow.
Now take a look at the raw “total views” data.

This is pretty substantial. Prior to WHP founding, the biggest year for total views was, unsurprisingly, 2017. But the first year of WHP blew that out of the water. I attribute the spike to calls for submissions. You can see our first call (which was advertised on reddit, facebook, horrortree, diabolicalplots/submission grinder, through authors publish, and in other places) generated the initial spike in April and May. When that call closed, there’s a slowdown on visits in June. Then I began posting in earnest about behind-the-scenes publishing stuff in July and visits actually returned to their call-for-submissions rates. We announced a second call for submissions in September (on the 1st, I think), and the site visits exploded.
Note that not only was the first call for subs our first ever (so there was no pre-existing word-of-mouth or returning-visitor machine operating at that time), but it also paid less on average than the second call ($35 flat vs. .06 per word). That probably drove that second bump of the year as well as it being our second call. I also don’t really know how to measure the impact of increased rate of book and film reviews (I had my most popular book review post—about The Stand—and my most popular film reviews—about A Complete Unknown and Nosferatu—in the last 30 days).
This month, we’ve posted our first visiting author “featured story” (and you should check that out), and I’ve continued posting behind-the-scenes information. We’ve also got authors awaiting word on acceptances/rejections for the second anthology, and that may be driving traffic as well. We’ll see what happens as we approach our first anniversary of founding WHP.
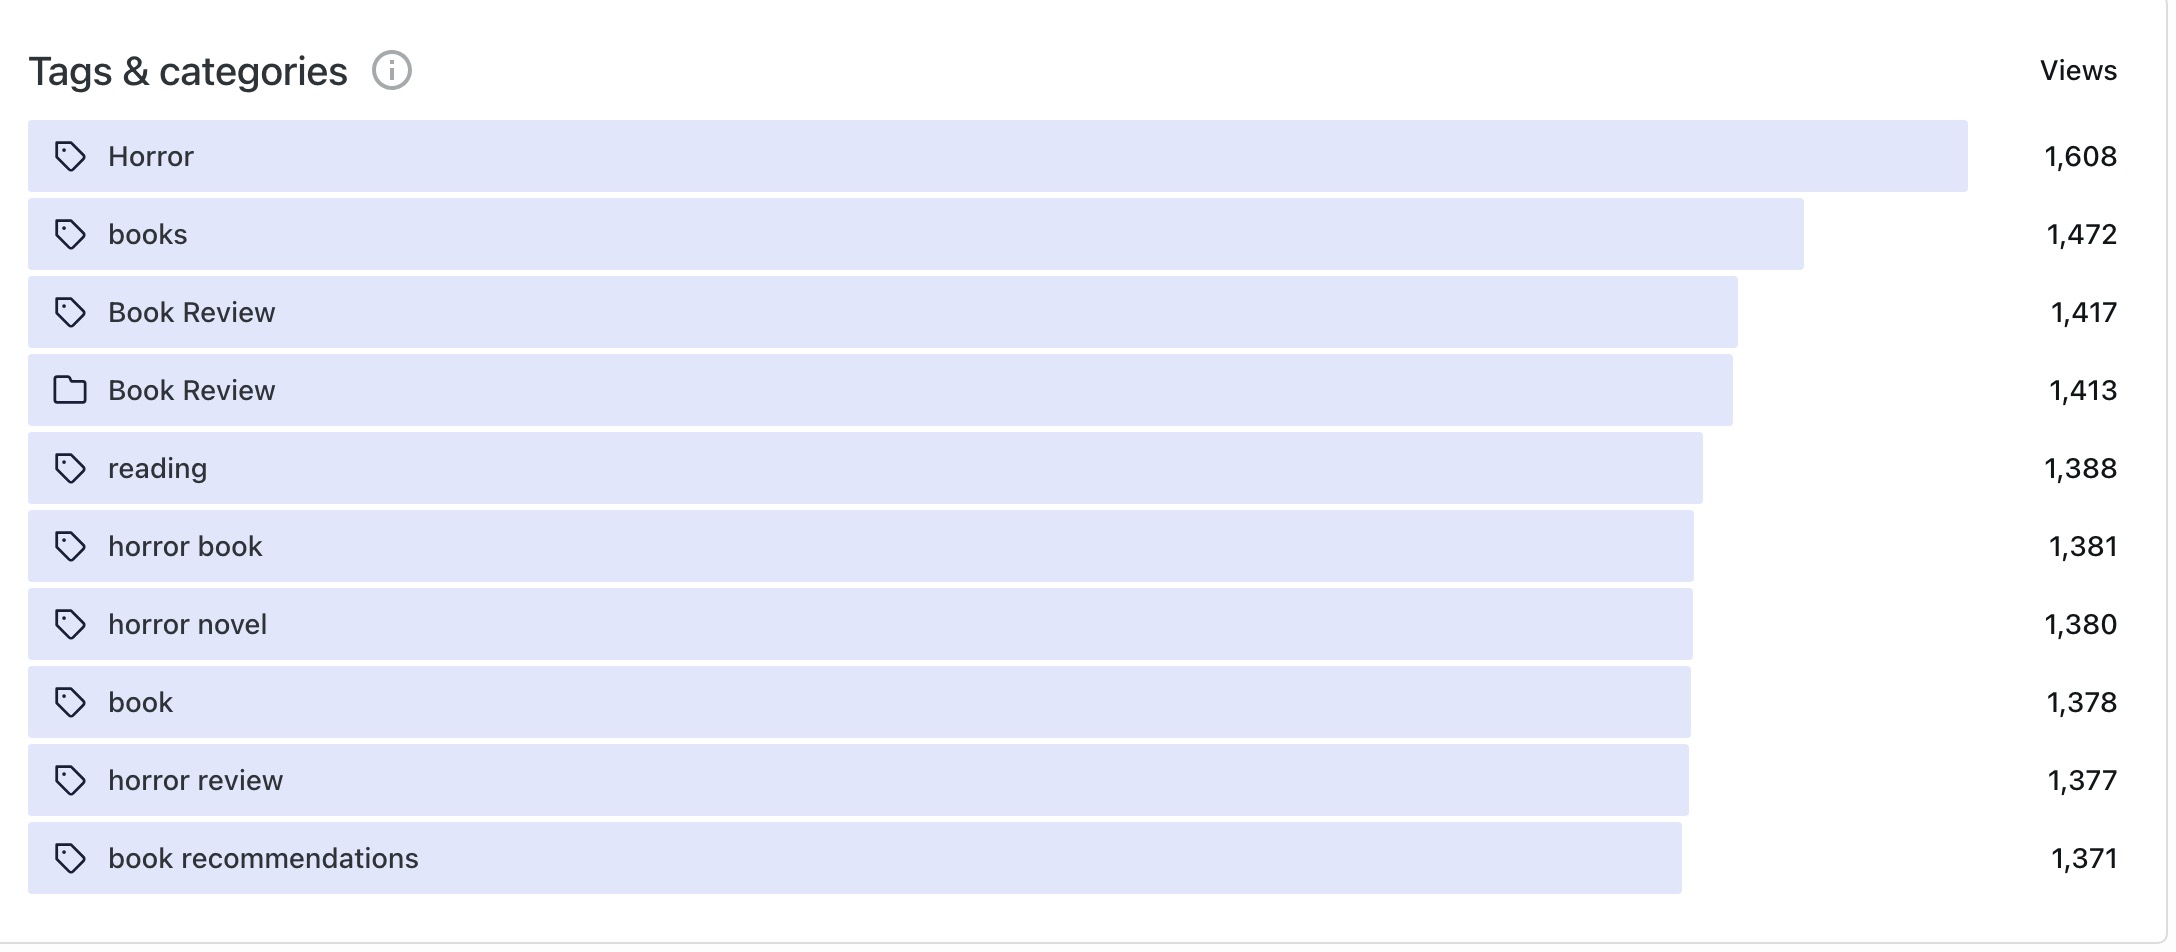
By post tag, which I apply with careful intention, here are our stats:
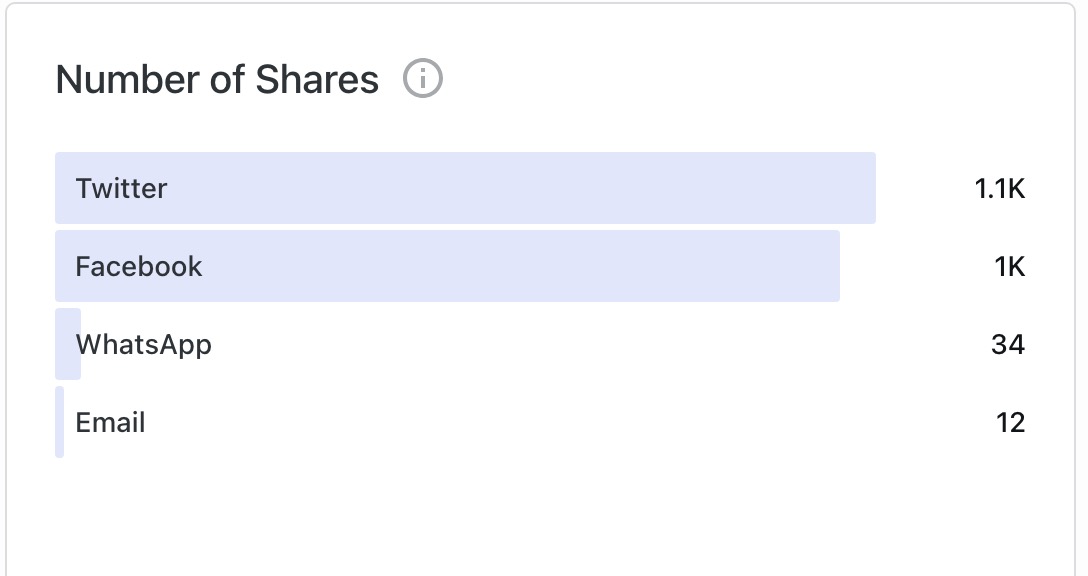
And as much as I dislike Twitter, here are the stats showing that it’s the place where folks have most shared our posts. (I wonder how BlueSky will look in a year… that data appears not to exist right now.)
Again, I don’t want to read too much into general site traffic data. It might or might not correlate with “success of Whisper House Press,” and whether or not it does share that relationship (and in a causal way) won’t be measurable for a few years, as best I can tell.
I’m open to suggestions and observations, especially as regards measuring the success of a brand whose primary products aren’t going to be released for many months.

Leave a comment